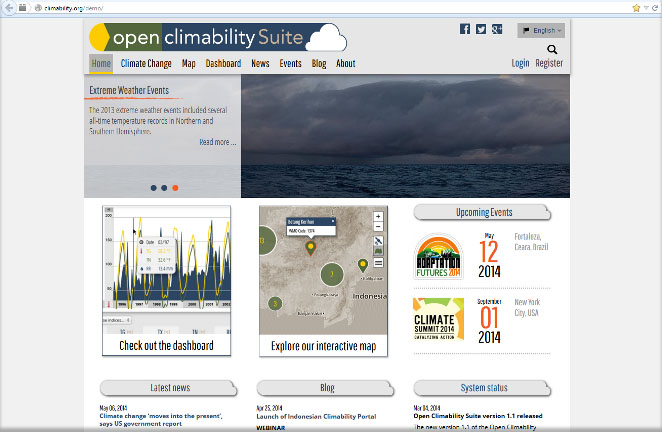
Climate information
Integrate climate (change) information, adapt the design of the portal. Add additional menus and integrate sectoral climate information.
The Climability Platform is based on the widespread open-source content management framework Drupal and uses different JavaScript frameworks for visualisation. Climate data is imported to MongoDB, a cross-platform document-oriented database system optimised for big data and fast data access. The architecture is robust and flexible for adaptations and extensions. An elaborate user management allows the fine-grained control of data access and visualisation. Different languages are already implemented into the platform.
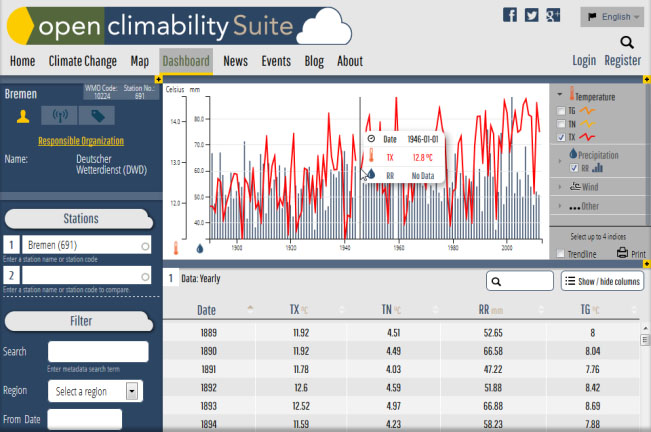
A complex dashboard is the main application of the Climability Platform. After selecting or filtering a climate station the appropriate climate data is loaded and shown in a graph and table. The available indices can be switched on or off here. The station metadata, which may also contain climate data interpretations, Walter-Lieth diagrams etc. are displayed in an information panel.
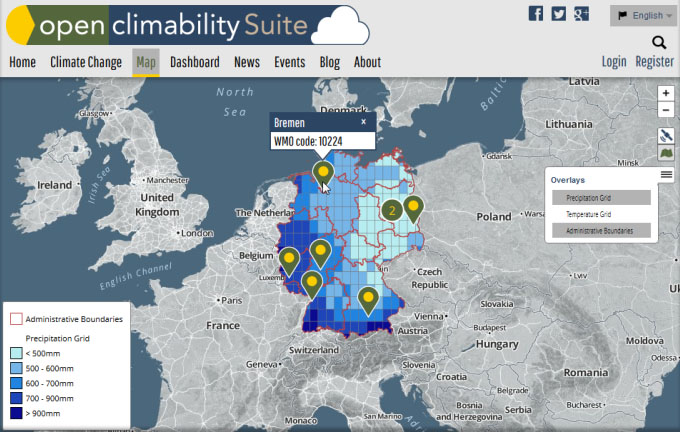
The Platform uses the popular JavaScript mapping library OpenLayers to display weather stations and gridded climate data on a map. The gridded data can also be animated over time. Additional base layers and overlays are easy to integrate. The map contains filter and select functions for climate stations and a temporal filter supports the preselection of time series. Clicking a station opens the dashboard and visualises the station data.
Integrate climate (change) information, adapt the design of the portal. Add additional menus and integrate sectoral climate information.
Integrate RSS feeds, news and events that are important or relevant to your institution.
Fine-grained management of data and function access. Easily add new users or edit user rights via complex Drupal user management.
Import climate stations and climate data into the NoSQL database MongoDB. Manage data entry and user access to data.
Use complex filter, search and select functions for climate stations and metadata, for climate values, time series or page contents.
Show climate indices information in graphs and compare to other climate stations. Use flexible time series to analyse the data.
Show table information for the indices of a climate station or compare with another station. Sort, filter, search and export table information as CSV file.
Enter, display and search climate station metadata. Get Walter-Lieth diagrams, station photos, and interpretations for the data. INSPIRE, OGC and WMO standards compliant.
Display climate station maps or gridded climate maps. Animate, filter, change base layers or add overlays (WMS, WCS) to adapt the map design and visualisation.